Personal what?
I have been a self-proclaimed personal finance nerd for over three years now. What started off as budgeting when I was living in London turned into discovering the delights of You Need a Budget, also known as YNAB, an envelope style budgeting software service (I won’t go into envelope budgeting - it’s something you can easily look up on your favourite search engine).
I was immediately hooked - I tracked every penny, set up categories, sub-categories, tracked average spend on each category, set targets, and was a happy bunny. I also noticed that I moved from feeling vaguely anxious and uneasy about money, to feeling very calm and relaxed knowing that I knew exactly where everything was at any given point.
Nerding intensifies
A while ago, YNAB increased their prices dramatically, and I decided to go it alone. I knew that there would be open source alternatives which would probably also be better, and sure enough I stumbled down the rabbit hole of Plain Text Accounting, specifically Beancount. I chose Beancount because it was written in Python, and had some great documentation.
There were some teething issues when it came to automation - I spent some time writing a script to retrieve email receipts of card transactions so that they would automatically be added to my ledger. I recently migrated away from using this and instead wrote some custom CSV importers for Beancount, which I run locally. I prefer it, as I only really need to ogle my finances once every few weeks, so ‘live’ transaction data isn’t as important.
Nerding intensifies further
I can get most of the information that I need very quickly with Beancount, but I generally have to click a few things, and being obsessed with all things automation, want to improve this. I also want to learn more about timeseries databases. I have used them a bit at work, but there is definitely more to be explored. I settled on InfluxDB for storing the data, and Grafana to visualise it.
As I am going to be exporting my ledger from Beancount to CSV, and don’t require the data to be ‘live’, I am almost certainly over-engineering this, but I want to learn the tools so don’t care! This architecture will also allow me to import metrics from my Home Assistant setup (which will have to be a topic for another time).
Setup
Data
Before I did anything else, I extracted the first of the queries I thought would be interesting; my expenses.
Using Beancount, you can run SQL-like commands on your ledger file, in my case this was:
SELECT date, sum(position), account \
WHERE account ~ 'Expenses:*' \
GROUP BY date, account
This provided me with a nice CSV file with the total spend for each Expense category for each day.
Components
I then set everything up locally to start off with:
brew install influxdb
brew install influxdb-cli
brew install grafana
I then ran influxd which runs a local instance of InfluxDB on port 8086.
Using the CLI to ‘put’ data in a bucket seemed sensible, so setting that up is as easy as:
influx config create --config-name cli \                                        ✭ ✱
  --host-url http://localhost:8086 \
  --org << ORG_NAME >> \
  --token << API_TOKEN >> \
  --active
Importing data into InfluxDB
Things started to get a bit trickier here. I had a CSV file which looked something like this:
| date | sum_position | account |
|---|---|---|
| 2020-01-02 | 10.00 GBP | Expenses:Holidays:SomeHoliday |
| 2020-01-03 | 20.00 GBP | Expenses:JustForFun:SomeCategory |
There were some problems with this:
sum_positionhasGBPafter the value. I’ve just done a find and replace for now, but when I set up a pipeline I will have to address this.- I’m not sure how I will filter down through accounts, for example to group by
Expenses:Holidaysrather than listing each Holiday. To be continued.
After reading some of the documentation on the annotated CSV features for InfluxDB (and a bit of banging my head against the keyboard), I settled on needing this command:
influx write -b budget -f expenses.csv -o admin --header "#datatype dateTime:2006-01-02,double,measurement"
-b is my bucket name
-f is the CSV file
-o is the organisation name
--header injects headers so that Influx DB knows how to read each column. You could achieve the same thing by adding a row at the top of the CSV file. As I don’t have timezone I have specified the dateTime format (I’m not clear on the exact formatting, I was expecting something similar to Python’s strftime, but it works with 2006-01-02, so who am I to argue). double, measurement, just means that the next two columns are the double datatype, then there is the measurement, an InfluxDB term which describes the data stored in the associated fields. I have a feeling at some point I will have to amend this, as otherwise we have a lot of different measurements!
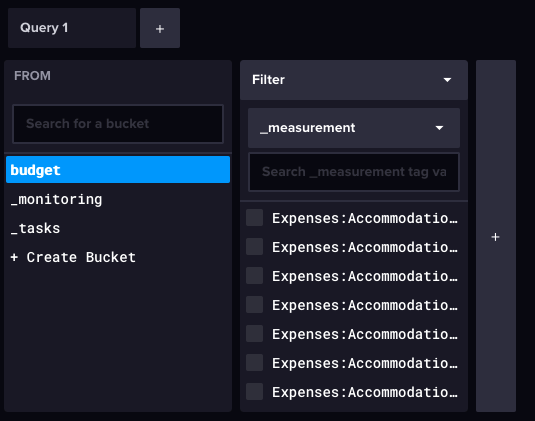
We can now see that we have the data in our InfluxDB instance:
Reading data from InfluxDB to Grafana
After some fun with the multi-user setup I have on my Mac, I installed Grafana with admin rights, then from my non-admin user, ran
brew services start grafana
The grafana dashboard then opened up on port 3000 (default username/password both admin), where you could configure the data source of InfluxDB using the same token from the CLI args, and setting Flux as the query language.
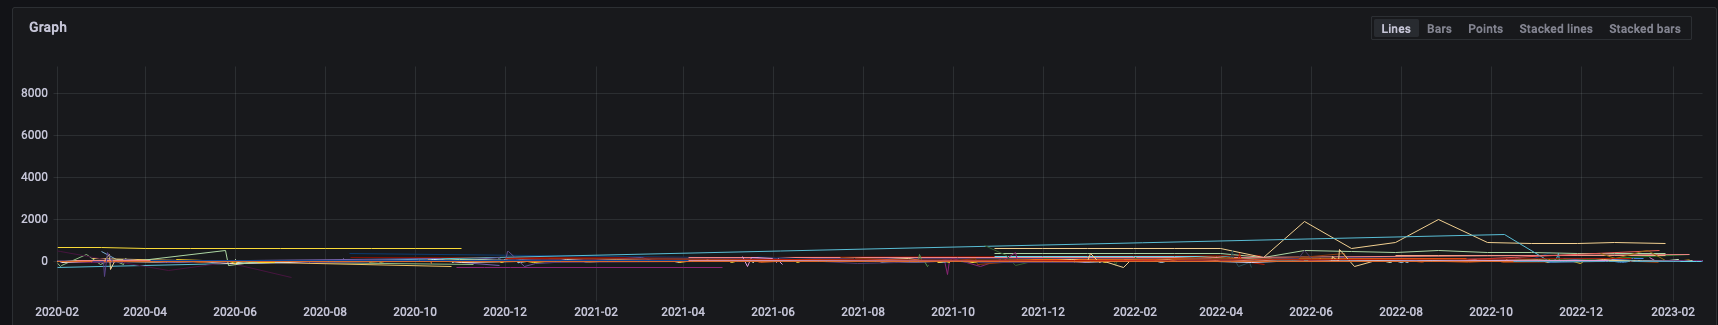
Using the Flux query language is most likely going to be a learning curve, but for now I have settled on a basic:
from(bucket: "budget")
  |> range(start: -4y)
  |> filter(fn: (r) => r["_measurement"]  =~ /Expenses:*/)
range is set to query everything from four years ago until now (i.e. everything - you can’t have no limit)
filter using regex on measurement to read every account I inserted into InfluxDB (as they are all Expenses:Something).
That gives me an absolutely horrible chart, but it’s working!
By refining it a bit, limiting it to one category (groceries), and adding an aggregateWindow clause, we get a much nicer graph.
from(bucket: "budget")
  |> range(start: -4y)
  |> filter(fn: (r) => r["_measurement"]  =~ /Expenses:ImmediateSpending:Groceries/)
  |> aggregateWindow(every: 1mo, fn: sum)
Output:
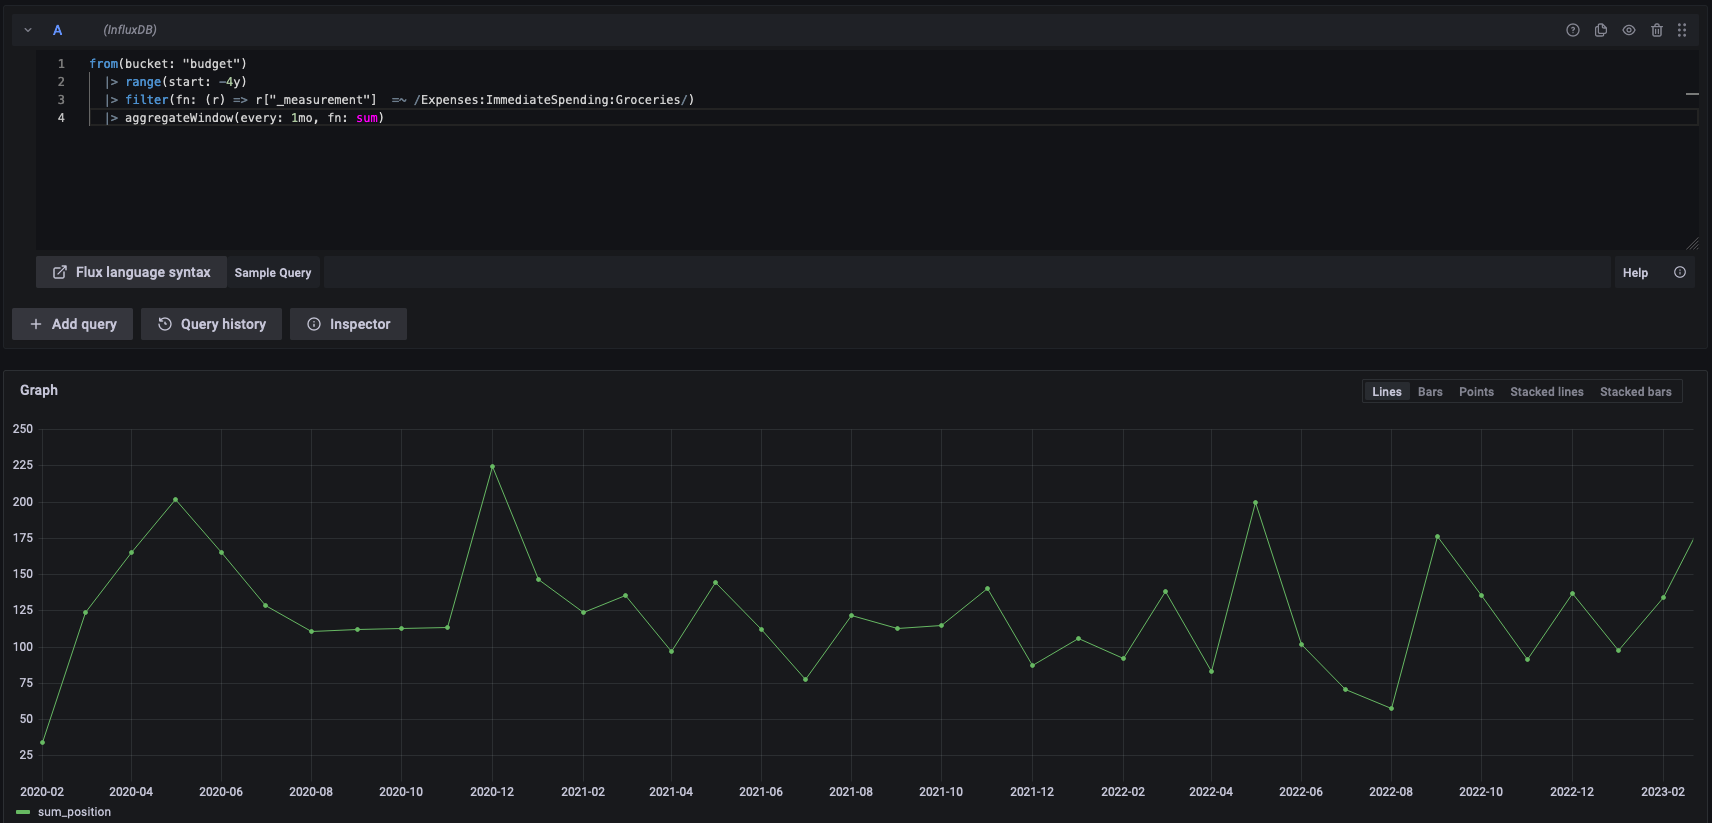
Strangely, the figures are all one month behind, but I’m sure there’s a logical explanation for this which I’m missing.
To be continued!